We're driving the transportation industry forward one graph at a time.
In a conscious effort to cater to you and your teams, we developed our first comprehensive Omnitracs Industry Intelligence Report: Understanding the Present to Predict the Future, released on March 11. This report will be the first in a continuous series of periodic releases. It provides thorough and highly beneficial transportation trends and industry performance insights, and it was created with you, your teams, and your business future in mind.
Insightful background
The report is comprised of insights on both over-the-road and last-mile transportation trends, safety behaviors, and sector-specific fleet data on month-by-month and year-by-year bases. Our comprehensive focus on the many sectors that our customers and prospects prioritize, such as the manufacturing and oil and gas sectors, provides you with much-needed knowledge into how the one or multiple sectors you work in have been performing. Additionally, we’ve developed many helpful and digestible graphs that easily showcase our data in visual form.
Using the largest database of miles driven, events reviewed, and stops made, we continue to develop unparalleled transportation intelligence, signifying our commitment to our position as a leading industry innovator.
The pandemic’s leading role
One of the most interesting findings to come out of the report is the varied effect the global COVID-19 pandemic had on national sectors. Unsurprisingly, fleets that knew how to retain drivers and cater to evolving customer needs, like e-commerce and contactless options, generally fared strongly. Here are a few of our many findings from our 2020 analyses:
- Sectors strongly varied on a month-by-month and seasonal basis. For example, after realizing the pandemic was here to stay for a while, many customers prepared their home gyms. This resulted in a strong resurgence in the sporting goods sector in May.
- Speeding increased during the pandemic — due to fewer overall drivers — for both regular drivers and truck/last-mile drivers. Our SmartDrive technology saw the average driving speed increase 7% from 2019 to 2020.
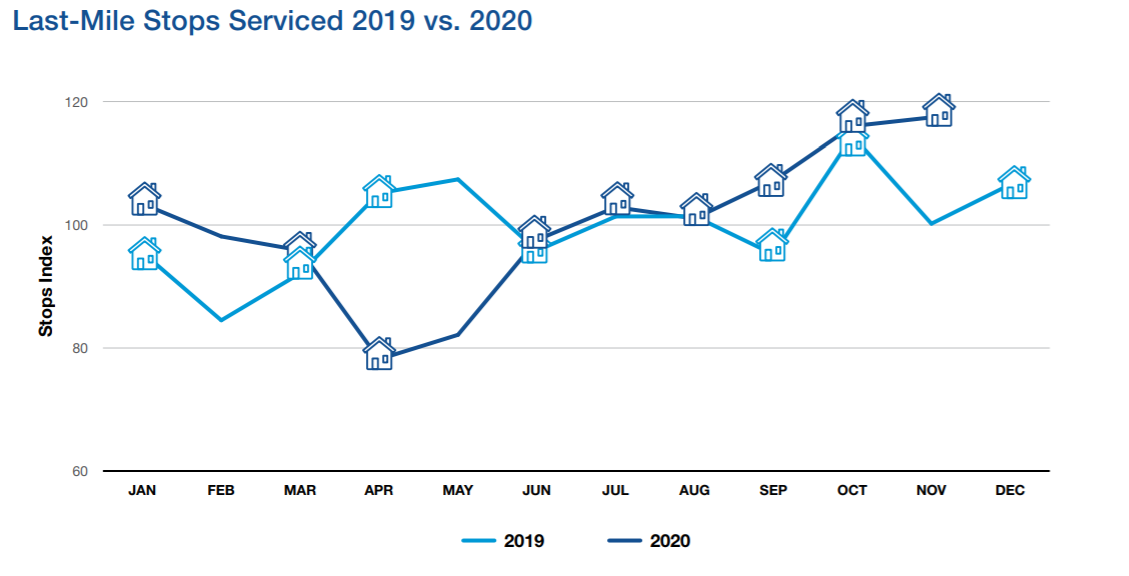
- E-commerce is growing — a lot. We saw growth on an upward trajectory after the pandemic caused a dip in April. Compared to 2019, last-mile fleets dealt with 21% more deliveries.
Below, find the last-mile 2019-2020 trends graph. This is one of our many carefully-crafted graph visuals.
![]()
Our research helps you help your business
Insights from our report are vital for business growth. With our findings on speed trends, for example, you can reprioritize driver coaching in your operation and help managers address the ramifications of speeding with drivers.
You can also use these trends to understand which technology is worth the investment. If you’re focused on speeding, you can utilize data evidence that points to concrete trends and justify purchasing enhanced video monitoring technology that monitors speeding and helps managers proactively coach drivers.
Our transportation intelligence efforts are an ode to industry diversity and visibility. We know our various customers have unique needs. Our Industry Intelligence Report signifies our commitment, from both a data and company perspective, to offer you the most beneficial analyses specific to your business vision.
Gain valuable graphs, granulated breakdowns for your sectors and business, and an understanding of how to use past trends for stronger future business. Download the ‘Industry Intelligence Report’ today.

